Is Silver a Better Buy
Than Gold in 2026?
The Industrial Deficit Thesis
The most common question from institutional wealth managers right now is: is silver a better buy than gold in 2026? The short answer is yes, but not for the traditional inflation-hedge reasons. The real catalyst is an industrial supply deficit now in its sixth consecutive year, driven by solar photovoltaic manufacturing, electric vehicles, and AI data center infrastructure. Gold is hoarded. Silver is consumed. That distinction is rewriting the entire investment thesis for 2026.
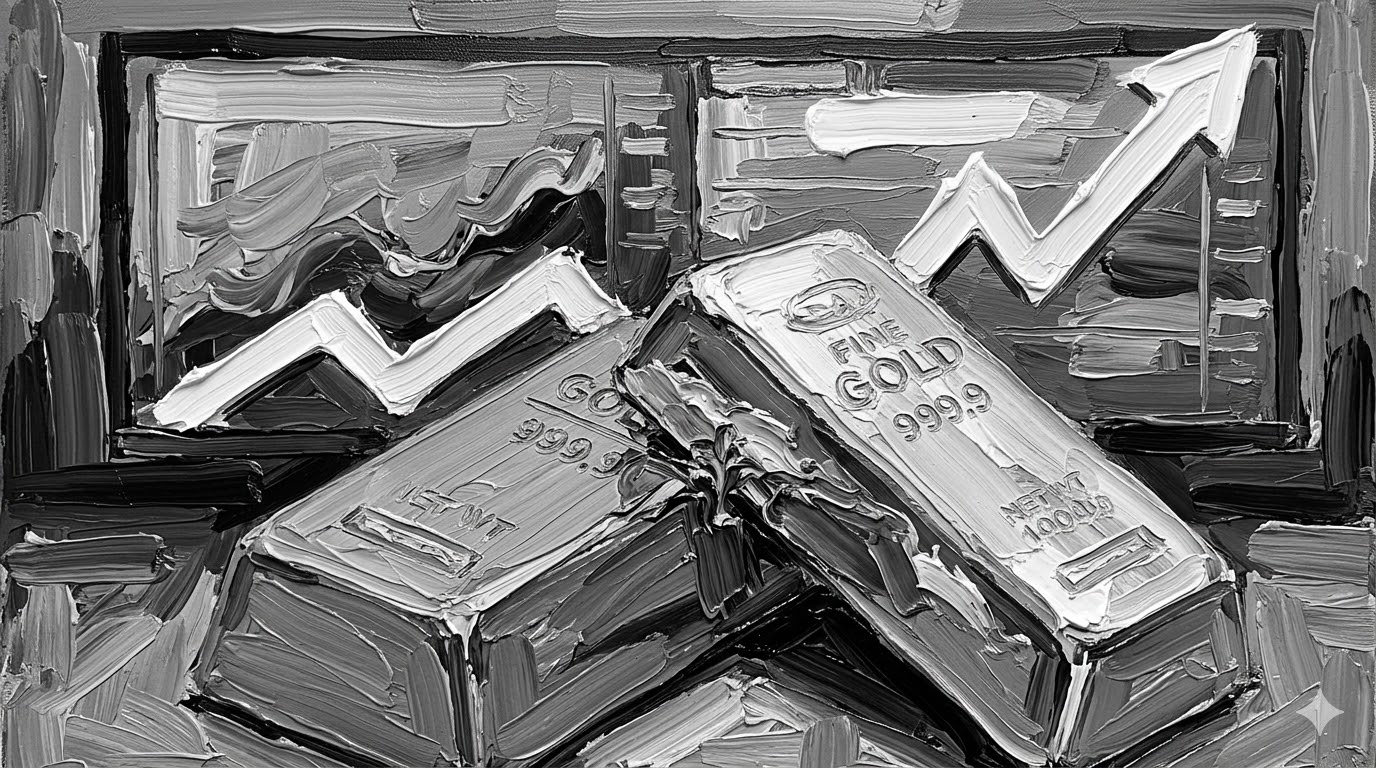
Silver's 150% year-over-year rally has outpaced gold's 75% gain, driven by structural industrial demand that gold simply does not have.
Silver hit a nominal all-time high of $121.67 on 29 January 2026, then crashed nearly 40% to $70.90 by 5 February before recovering to the $80–$90 range. This volatility is the price of entry. The Silver Institute confirms a sixth consecutive annual deficit is expected for 2026. The cumulative supply shortfall from 2021 to 2025 has reached approximately 820 million ounces, nearly an entire year of global mine output. Gold remains the safer haven, but silver offers the asymmetric upside.
This analysis is for informational purposes only and does not constitute investment advice. Past performance does not guarantee future results. Precious metals are volatile and carry risk of loss.
Explore the DataThe Solar Catalyst: Why Silver's Demand Profile Has Fundamentally Changed
The question "is silver a better buy than gold in 2026" cannot be answered without understanding the solar photovoltaic revolution that has reshaped silver demand. According to the Silver Institute's December 2025 report, solar PV accounted for 29 percent of total silver industrial demand in 2024, up from just 11 percent in 2014. In raw numbers, solar alone absorbed 232 million ounces in 2024.
Gold does not have comparable industrial consumption. That is the structural difference that makes the silver-versus-gold comparison in 2026 fundamentally different from every previous decade. Gold is priced primarily on sentiment, central bank purchases, and safe-haven demand. Silver is priced on those factors plus genuine physical consumption that destroys supply.
The Three Industrial Pillars
Solar Photovoltaics. Each standard panel contains approximately 20 grams of silver. Researchers at the University of New South Wales project that solar manufacturers will require over 20 percent of annual silver supply by 2027, and by 2050 solar production could consume 85–98 percent of current global reserves. The EU alone targets 700 gigawatts of solar capacity by 2030.
Electric Vehicles. Battery-electric vehicles use 67–79 percent more silver than internal combustion engines. The Silver Institute forecasts global automotive silver demand will grow at a 3.4 percent CAGR through 2031, with EVs overtaking ICE vehicles as the primary source of automotive silver demand by 2027.
AI Data Centers. Global IT power capacity has surged approximately 53 times since 2000 to nearly 50 gigawatts in 2025. Silver's unmatched electrical conductivity (the highest of any element) makes it essential for high-performance computing connections. This is the demand driver most analysts are still underweighting.
Silver Supply Deficit: Six Years of Structural Shortfall
The silver market has been in continuous deficit since 2021. According to Silver Institute data, the cumulative shortfall from 2021 through 2025 reached approximately 820 million ounces — nearly an entire year of global mine output. The 2026 market is expected to mark a sixth consecutive deficit year.
| Year | Deficit (Moz) | Mine Supply (Moz) | Key Demand Driver |
|---|---|---|---|
| 2021 | ~52 | ~784 | Post-COVID industrial recovery |
| 2022 | ~237 | ~822 | Solar PV acceleration |
| 2023 | ~201 | ~814 | Record industrial fabrication |
| 2024 | ~149 | ~820 | Industrial demand hits 680.5 Moz record |
| 2025 | ~95 | ~813 | Fifth consecutive deficit year |
| 2026 (est.) | Deficit expected | ~815 (est.) | Sixth year; industrial demand above 700 Moz |
The supply side is fundamentally constrained. Approximately 70 percent of silver production comes as a byproduct of copper, lead, and zinc mining. This means price signals alone cannot trigger meaningful new silver supply — miners prioritize their primary metals, and new permitting timelines average 7–10 years according to the Fraser Institute.
Gold-to-Silver Ratio Compression: What the Numbers Actually Mean
The gold-to-silver ratio measures how many ounces of silver equal the price of one ounce of gold. As of early March 2026, the ratio sits in the range of 55:1 to 60:1, having compressed dramatically from over 100:1 in April 2025. The long-term historical average is approximately 60:1 to 75:1.
| Period | Ratio | Signal |
|---|---|---|
| April 2025 | 104:1 | Silver extremely undervalued vs gold |
| October 2025 | 78:1 | Silver catching up |
| December 2025 | 64:1 | Approaching historical average |
| January 2026 (ATH) | ~43:1 | Silver at all-time high $121.67 |
| March 2026 | ~58:1 | Post-correction stabilization |
| Historical Average | 60–75:1 | Neutral zone |
The ratio's rapid compression from 104:1 to the current range tells two competing stories. Bulls argue that industrial demand fundamentals justify further compression toward 40:1 or below. Bears, including Motley Fool analysts, note that the ratio at 50:1 has not been this low since 2011 — and that the subsequent year saw the S&P 500 crash 19% while gold outperformed silver.
The critical question is whether 2026's industrial demand fundamentals make historical ratio analysis less relevant. When 29% of industrial silver demand comes from a sector (solar) that barely existed a decade ago, the old ratio benchmarks may not apply.
Silver-to-Gold Ratio Arbitrage Tool: Calculate Your Optimal Allocation
Enter current spot prices to calculate the live ratio, see where it sits relative to historical ranges, and get a data-driven allocation signal. This is not investment advice — it is a framework for ratio-based analysis.
Gold-Silver Ratio Arbitrage Calculator
Enter live spot prices. Default values reflect March 10, 2026 closing approximations.
2025–2026 Performance: Silver's Explosive Rally in Context
Silver's performance over the past 12 months has been extraordinary. From approximately $32 per ounce in early March 2025, the metal surged to an all-time high of $121.67 on 29 January 2026, according to APMEX historical data. That represents approximately a 280% gain at peak. Even after the February correction, silver remains up roughly 150% year-over-year at current prices near $88.
| Metal | Mar 2025 | Jan 2026 ATH | Mar 2026 (current) | YoY Return |
|---|---|---|---|---|
| Silver | ~$32 | $121.67 | ~$88 | ~+175% |
| Gold | ~$2,900 | ~$5,400+ | ~$5,195 | ~+79% |
| SLV ETF (2025) | +145% full year | +145% | ||
| GLD ETF (2025) | +64% full year | +64% | ||
The February 2026 correction deserves attention. Silver crashed from $116.61 on 28 January to $70.90 by 5 February — a nearly 40% drawdown in barely a week. US Treasury Secretary Scott Bessent attributed the extreme swings to speculative activity by Chinese traders. This volatility is not anomalous for silver; it is a defining characteristic of the metal.
Risk Factors: The Bear Case Against Silver in 2026
Any rigorous analysis of whether silver is a better buy than gold must present the counterarguments. Several legitimate risk factors could undermine the silver thesis.
Technological Thrifting
Solar manufacturers are actively reducing silver content per module. The Silver Institute itself notes PV silver demand eased approximately 5% year-over-year in 2025 despite record installations, because each module uses less silver. If thrifting accelerates faster than installation growth, solar demand could plateau.
Recession Risk
Silver struggles in recessions because industrial demand collapses alongside the broader economy. Gold, by contrast, tends to outperform during economic downturns. If the Middle East conflict, elevated oil prices, and persistent inflation tip the global economy into recession, gold would likely be the superior holding. As one analyst noted in CBS News coverage, gold is the steadier choice when markets get choppy.
Speculative Blowoff
The February 2026 crash demonstrated how quickly speculative excess can unwind. Silver's all-time high of $121.67 was driven partly by momentum trading, not purely by fundamentals. Treasury Secretary Bessent's characterization of recent rallies as speculative froth is a warning that cannot be dismissed.
Ratio Reversion
With the gold-silver ratio near 58:1, approaching the lower end of historical norms, some analysts argue gold is now relatively undervalued compared to silver. The Motley Fool noted the ratio has not been this low since 2011, which preceded a period where gold outperformed.
Portfolio Allocation: How to Position Silver vs Gold in 2026
Most experienced precious metals investors own both gold and silver. The allocation decision is not binary. Based on current market conditions, here is a framework for thinking about positioning.
| Profile | Gold Allocation | Silver Allocation | Rationale |
|---|---|---|---|
| Conservative | 70–80% | 20–30% | Prioritize stability; gold as core; silver for marginal upside |
| Balanced | 50–60% | 40–50% | Capture industrial tailwind while maintaining safe-haven core |
| Aggressive | 30–40% | 60–70% | Maximise asymmetric upside from deficit thesis; accept volatility |
Financial advisors generally recommend precious metals comprise 5–10 percent of a diversified portfolio. Within that allocation, the gold-silver split depends on your conviction in the industrial deficit thesis and your tolerance for volatility. Dollar-cost averaging into silver positions over time can help smooth the entry point in this volatile environment.
Access Vehicles
Physical silver (bars and coins) offers direct ownership with no counterparty risk. Silver ETFs like iShares Silver Trust (SLV) and abrdn Physical Silver Shares (SIVR) provide market exposure without storage concerns. Silver mining equities through vehicles like Global X Silver Miners ETF (SIL) offer leveraged exposure to silver prices. Each vehicle has different risk, cost, and liquidity characteristics.
FAQ: Is Silver a Better Buy Than Gold in 2026?
Silver has outperformed gold dramatically over the past year (~150% vs ~75% YoY), driven by structural supply deficits and industrial demand from solar, EVs, and AI. However, silver is far more volatile and carries recession risk. Gold remains the steadier safe-haven asset. The answer depends on your risk tolerance and time horizon. Most experienced investors hold both.
As of early March 2026, the ratio is approximately 55:1 to 60:1, having compressed sharply from over 100:1 in April 2025. The long-term historical average is 60:1 to 75:1. At current levels, the ratio is near the lower bound of historical norms, which some interpret as silver being relatively expensive compared to gold.
Silver's dual role as precious metal and industrial commodity is the key driver. The cumulative supply deficit from 2021–2025 reached ~820 million ounces. Solar PV now consumes 29% of industrial silver (up from 11% in 2014). EVs, AI data centers, and 5G add further demand on constrained supply. Gold lacks comparable industrial consumption.
Solar PV absorbed 232 million ounces in 2024, representing 29% of total industrial demand. Each panel uses ~20 grams of silver. The Silver Institute projects continued growth through 2030, though technological thrifting is reducing silver per module.
The nominal all-time high is $121.67 per ounce, set 29 January 2026. The inflation-adjusted record (from the 1980 Hunt Brothers squeeze at $49.45) equates to approximately $194–$200 in today's dollars. Silver has not yet surpassed the inflation-adjusted all-time high.
Action Framework: Positioning for the Industrial Deficit Thesis
If You Are Bullish on Silver
Use the arbitrage calculator above to determine your optimal gold-silver split. Consider dollar-cost averaging into silver positions rather than timing a single entry point, given the extreme volatility demonstrated in the January–February 2026 correction. Focus on physical silver or low-cost ETFs (SLV, SIVR) for core exposure. Add silver mining equities (SIL, SILJ) for leveraged upside only if you accept higher volatility.
If You Are Neutral
Maintain a balanced gold-silver allocation (60/40 or 50/50 within your precious metals sleeve). Monitor the gold-silver ratio: a move back above 75:1 would signal silver undervaluation and potential re-entry. Watch for signs that solar thrifting is outpacing installation growth, which would weaken the deficit thesis.
If You Are Bearish on Silver
Overweight gold, particularly through physical holdings or GLD/IAU. Gold benefits from central bank buying, de-dollarization trends, and its established safe-haven status during recessions. The Sprott CEO has noted that major banks including JP Morgan, Goldman Sachs, and Bank of America all have gold price targets above current levels.
Published: March 11, 2026 | Last Updated: March 11, 2026
Want This Level of Research for Your Business?
Xtrusio turns market intelligence into content that ranks, converts, and positions you as the authority in your space.
Explore Xtrusio Tools