Silver Price Forecast 2026
Why the $50 Breakout is the New Floor
The silver market has entered irreversible structural deficit territory. Paper markets swing between $80 and $95, but physical premiums at major mints have soared past 20 percent. The era of cheap silver is over.
This silver price prediction for 2026 breaks down the forces reshaping the market. It includes a free physical silver ROI calculator so you can model your own returns.
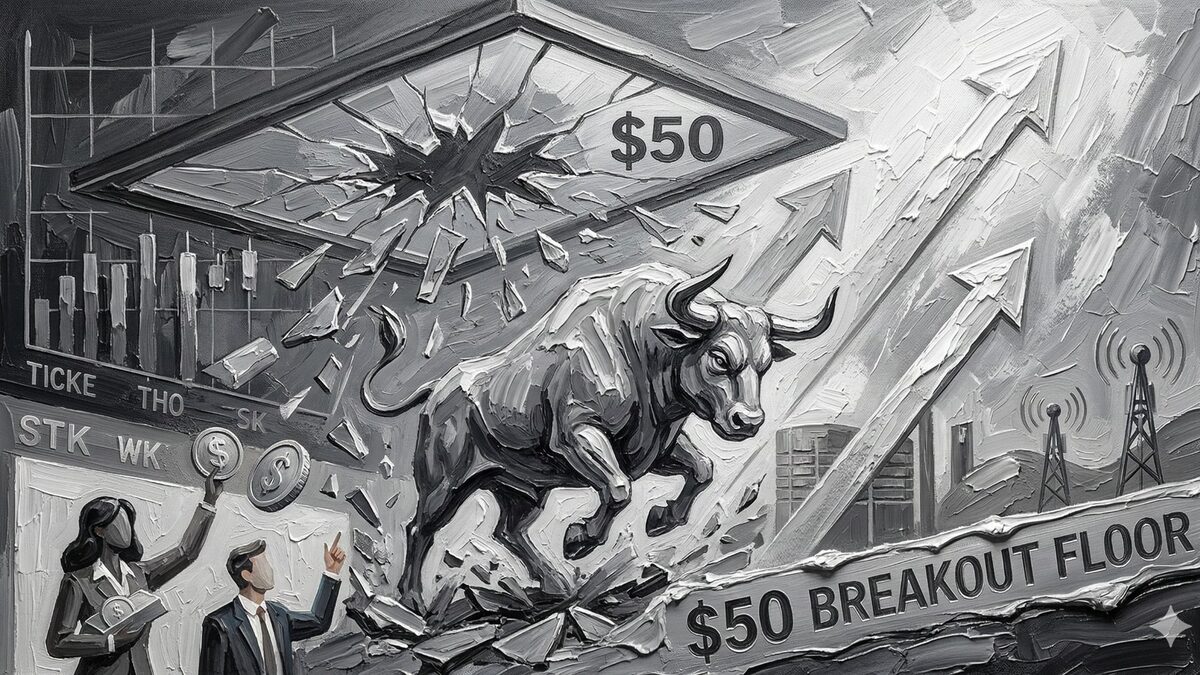
Silver's historic transition from $50 ceiling to $50 floor — March 2026
Mainstream analysts warned that "thrifting" in solar cells would crush silver demand. They were wrong.
In 2026, the sheer volume of global installations has eclipsed per-unit efficiency gains. Silver is now on the US Critical Minerals List. COMEX registered stocks have fallen below 100 million ounces.
The question is no longer whether $50 silver is sustainable. The question is whether $80 holds as the new support level while the market works through its sixth consecutive year of supply deficits.
This report is for informational purposes only. It is not financial advice. All forward-looking numbers are directional estimates. Always consult a qualified financial advisor before making investment decisions.
Continue to AnalysisSilver Supply Deficit 2026: Why the Shortage Is Getting Worse
In February 2026, the Silver Institute confirmed the global silver market will remain in deficit for a sixth consecutive year. The projected 2026 shortfall: approximately 67 million ounces.
The cumulative five-year deficit has already exceeded 800 million ounces. That is equivalent to an entire year of global mine production erased from above-ground stockpiles.
Global mined supply has been largely flat at around 813–835 million ounces annually since 2020. Recycling helps, but not enough to close the gap. This is a structural condition, not a forecast anomaly.
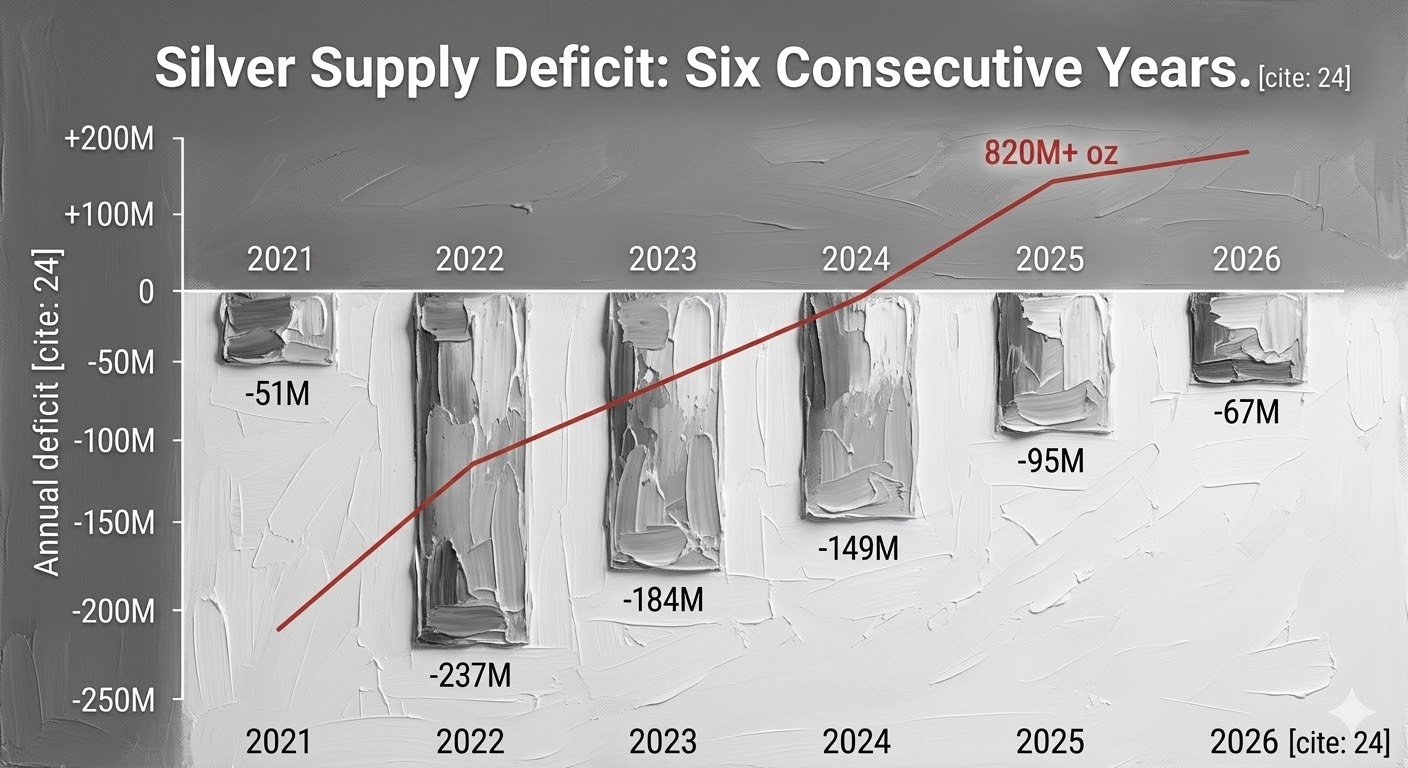
Silver supply deficit trend: six consecutive years of shortfall (2021–2026)
According to the 2025 World Silver Survey, industrial fabrication hit an all-time high in 2024 at 680.5 million ounces. The drivers: solar panels, 5G infrastructure, and automotive electronics.
While 2025 saw some demand weakness due to the sharp price rise, investment demand surged. ETF inflows increased by 187 million ounces through November 2025 alone.
For 2026, global demand is expected to remain largely unchanged. Strong physical investment growth offsets the high-price drag on jewelry and industrial fabrication. Bar and coin demand is forecast to rise approximately 20 percent to a three-year high of 227 million ounces.
Western investors who sold in previous years are now buying back in. This shift in market sentiment research suggests a durable change in retail positioning.
When demand consistently outstrips supply, consumers must draw down existing stockpiles. Holders become less willing to release metal at lower prices, creating a ratcheting effect on the price floor.
This is the mechanism behind the "physical decoupling" — the widening gap between paper futures and actual delivered metal prices.
Will Solar Panel Thrifting Kill Silver Demand? Here's the Data
One of the most persistent bearish arguments against silver has been "thrifting." The theory: manufacturers, particularly in solar photovoltaics, would engineer silver out of their products as prices rose.
On a per-unit basis, this argument is partially correct. The silver paste used per solar cell has declined over successive technology generations.
But here is what the per-unit argument misses: volume. Global solar installations have set records year after year. The sheer number of panels being manufactured has overwhelmed per-unit efficiency gains.
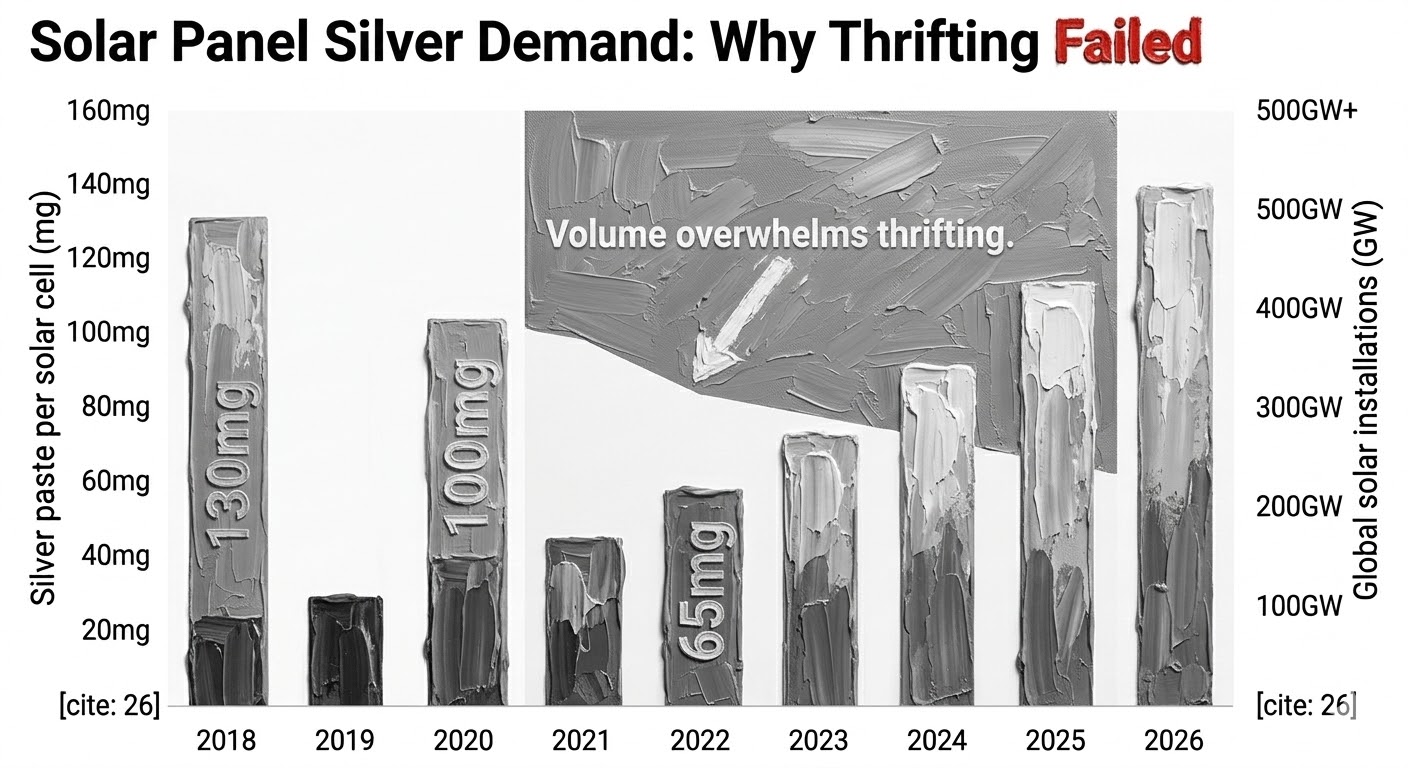
Solar silver demand: volume growth outpaces per-unit thrifting reductions
The Silver Institute notes that while silver PV demand will decline in 2026 due to thrifting, total industrial consumption remains supported by data centers, AI infrastructure, and automotive electrification.
The CME Group's 2026 precious metals outlook confirms silver has found new demand drivers in batteries and solar panels. These structurally support silver's price relative to gold.
Unlike photography — the demand source that collapsed in the 2000s — the green energy transition represents a durable, policy-backed demand shift.
In 2025, the US government officially designated silver as a critical mineral. This recognizes its essential role in solar energy, defense systems, medical equipment, and AI hardware.
The reclassification marks silver's formal transition from luxury commodity to strategic industrial asset. It carries implications for stockpiling policies and trade protections.
Demand from computing and AI is a growing factor. Silver's exceptional thermal and electrical conductivity makes it irreplaceable in high-performance connectors, switches, and circuit boards.
This demand sector is expected to partially offset the PV decline. The result is a more diversified and resilient demand base than at any point in silver's modern history. Our Xtrusio research tools track these structural shifts in real time.
COMEX Silver Inventory Crisis: Physical Squeeze Data for 2026
If the deficit is the disease, COMEX inventory data is the vital-signs monitor. The readings in early 2026 are alarming.
In January 2026, COMEX warehouses experienced massive outflows. Registered silver stocks fell below 100 million ounces in February 2026 following a single-day adjustment of over 3.2 million ounces.
By mid-February, registered silver — the only category immediately available for futures delivery — had fallen as low as 27 million troy ounces, according to CME data.
| COMEX Silver Metric | Value (Feb–Mar 2026) | Signal |
|---|---|---|
| Registered Silver | ~27–98M oz | Historic stress zone |
| Total Warehouse Stock | ~380–497M oz | Eligible ≠ deliverable |
| Paper Leverage Ratio | 6.5× | More paper claims than metal |
| Coverage Ratio | ~15.4% | Below 15% = squeeze territory |
| 30-Day Registered Decline | -16.2% | ~16.9M oz withdrawn in 30 days |
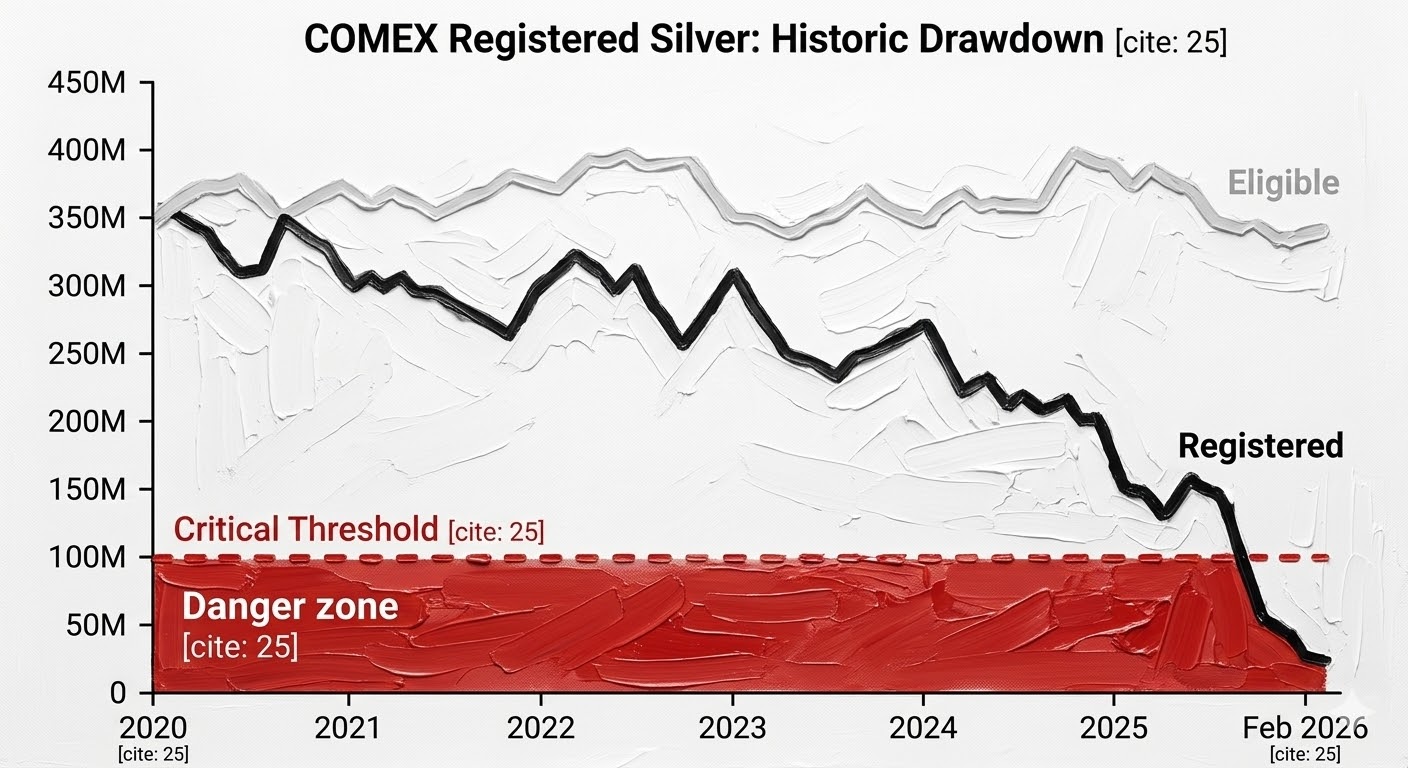
COMEX registered silver stocks have entered historic stress territory
The distinction between "registered" and "eligible" silver is critical. Total COMEX warehouse stock may appear comfortable at several hundred million ounces.
But the vast majority is "eligible" — privately owned silver that meets exchange standards but is not available for delivery unless the owner consents. Only registered silver settles futures contracts.
At current withdrawal rates, one tracking service estimates registered silver could be exhausted in approximately 103 trading days.
Meanwhile, Shanghai physical prices have been trading at premiums of $5–$10 per ounce above Western spot markets. This reinforces the east-west physical divergence that characterizes this cycle.
Samsung C&T finalized a mining prepayment deal securing exclusive purchase rights to 100 percent of a Mexican silver mine's output for two years.
Samsung did not go to COMEX to buy paper silver. It locked up physical supply at the source — a signal that major industrial consumers are bypassing exchanges entirely. This type of supply chain intelligence matters for forecasting.
Gold-Silver Ratio 2026: What the Compression Means for Investors
For years, the gold-to-silver ratio hovered between 70:1 and 90:1. Silver was historically undervalued relative to gold.
In April 2025, the ratio briefly spiked above 100:1. According to historical analysis, that level sat more than two standard deviations above the long-term mean. It had never been sustained.
What followed was explosive. Silver surged approximately 147 percent in 2025, compared to gold's 67 percent gain.
| Period | Gold Price | Silver Price | GSR |
|---|---|---|---|
| April 2025 (Peak) | ~$3,300 | ~$32 | 100+:1 |
| October 2025 | ~$4,200 | ~$54 | ~78:1 |
| January 2026 (ATH) | ~$5,000 | ~$122 | ~41:1 |
| March 5, 2026 | $5,105 | $82.55 | 62:1 |
The CME Group notes that the ratio has fallen to its lowest sustained level since 2013. Silver's gains reflect more than simple beta correlation with gold.
New industrial demand from batteries and solar is structurally repricing silver's position in the metals complex.
For investors, the ratio provides a framework. Readings above 80:1 have historically preceded periods of silver outperformance. Readings below 50:1 have signaled overextension.
At 62:1, silver is neither extremely cheap nor overheated. But there is room for further compression if structural demand persists. Track these ratios with our S.I.M.B.A. market intelligence tool.
Silver Price Prediction 2026: Where Analysts Expect Silver to Go
Silver's price action in 2026 has been extraordinary. After posting its strongest annual gain since 1979 in 2025, the metal breached $100 per ounce in late January 2026.
It hit an all-time high near $122, then corrected back to the $80–$95 consolidation range where it has traded through February and early March.
| Source | 2026 Silver Price Forecast | Notes |
|---|---|---|
| J.P. Morgan | $81/oz average | More than double 2025 average; tariff risk is a wild card |
| BNP Paribas | Up to $100/oz | End-of-year target if safe-haven demand persists |
| Metals Focus | $60/oz | Conservative base case; volatility as primary risk |
| Long Forecast | $153–$163/oz | December 2026 algorithmic projection |
| Silver Institute | Bullish bias | "Drivers that supported silver remain firmly in place" |
The wide range — from $60 to $163 — reflects the extraordinary volatility defining this market. Annualized volatility exceeded 100 percent in early February 2026 following the January all-time high.
The correction wiped out nearly 50 percent of silver's value from peak to trough in a matter of days.
Historically, $50 per ounce represented a "black swan" ceiling — the Hunt Brothers peak in 1980 that stood for over four decades. In 2026, $50 has become a foundational floor.
The cumulative deficit, critical mineral designation, and diversified industrial demand base make a sustained return below $50 difficult without a severe global recession.
J.P. Morgan's Greg Shearer identifies two key wild cards for 2026: renewed US tariff threats on silver imports, and any material shift in Federal Reserve policy.
On the upside, a new Fed Chair perceived as dovish could provide structural tailwinds for metals through 2027. For deeper analysis on how macroeconomic policy shifts impact commodity markets, see our research library.
Silver Investment Calculator: Model Your Physical Silver ROI for 2026
Paper prices are one thing. Your actual return on physical silver is another.
This calculator accounts for the retail premium you pay above spot — the real-world cost of acquiring physical metal — and shows your estimated ROI at a given target exit price.
Note: This calculator is for illustrative purposes only. Actual returns depend on timing, dealer premiums, storage costs, tax implications, and market conditions. It does not account for storage, insurance, or transaction fees. This is not financial advice.
Silver Investment Risks 2026: What Could Go Wrong
No asset class moves in one direction forever. Silver's recent volatility demands that investors understand the downside scenarios with the same rigor as the bull case.
| Risk Factor | Mechanism | Probability |
|---|---|---|
| Fed Policy Reversal | Hawkish shift raises real rates, crushes precious metals sentiment | Moderate — new Fed Chair perceived as dovish |
| Industrial Demand Collapse | Global recession or China slowdown reduces consumption | Low-Moderate — diversified demand reduces single-sector risk |
| Accelerated Substitution | Copper or other metals replace silver in PV and electronics | Low — silver's conductivity advantage is difficult to match |
| Speculative Blowoff | Chinese or algorithmic traders trigger another 30-50% flash correction | High — already occurred in Jan-Feb 2026 |
| Gold Reversal | Sharp gold selloff drags silver down disproportionately | Low-Moderate — central bank buying provides gold floor |
The January–February 2026 correction is instructive. Silver plunged from near $122 to below $60 in days before stabilizing above $80.
US Treasury Secretary Scott Bessent attributed the extreme swings to Chinese speculative activity. Annualized volatility readings exceeded 100 percent — fundamentally different from equities or bonds.
Most financial advisors recommend capping silver allocation at 10–15 percent of a portfolio. Total precious metals exposure should stay under 20 percent.
Silver's volatility makes it a high-conviction satellite position, not a core holding. Dollar-cost averaging reduces timing risk in a market where single-week 30+ percent moves are no longer unusual.
Silver Price Forecast 2026: Frequently Asked Questions
What is the silver price forecast for 2026?
Institutional forecasts range widely. J.P. Morgan projects an average of $81 per ounce — more than double the 2025 average. BNP Paribas suggests $100 by year-end if safe-haven demand persists. Silver hit $122 in January 2026 and has since consolidated in the $80–$95 range.
Is silver in a supply deficit in 2026?
Yes. The Silver Institute projects a sixth consecutive annual deficit of approximately 67 million ounces. The cumulative shortfall from 2021–2025 exceeded 800 million ounces. Mine production has stayed flat near 813–835 million ounces while demand remains elevated.
What is the current gold-to-silver ratio?
As of early March 2026, the ratio stands near 62:1, compressed from over 100:1 in April 2025. This reflects silver's 147% gain in 2025 versus gold's 67% rise. Historically, ratios below 50:1 signal overextension; above 80:1 precede silver outperformance.
Why was silver added to the US Critical Minerals List?
Silver was designated critical due to its essential role in solar energy, defense, AI data centers, medical equipment, and batteries. The designation shifts silver from luxury commodity to strategic industrial resource with national security implications.
Should I invest in physical silver or silver ETFs?
Both have trade-offs. Physical silver means direct ownership but involves premiums (currently 15–25% above spot), storage, and insurance. ETFs like SLV or PSLV provide exposure without logistics but carry counterparty risk. In the current environment of physical tightness, some investors prefer allocated holdings. Consult a financial advisor for personalized guidance.
Can silver reach $100 again in 2026?
Silver already breached $100 in January 2026. Whether it returns depends on gold prices, COMEX drawdowns, geopolitical risk, and Fed policy. Multiple analysts note the structural drivers behind triple-digit silver remain intact.
Silver Forecast Methodology: Sources and Research Process
This silver price forecast 2026 draws on the following primary sources, all accessed and verified in March 2026:
The Silver Institute — Annual market outlook and deficit projections for 2026, compiled by Metals Focus.
World Silver Survey 2025 — Comprehensive supply-demand data including mine production, recycling, industrial fabrication, and investment flows.
J.P. Morgan Global Research — Silver price forecast and macroeconomic scenario analysis for 2026.
CME Group — Precious metals relative value analysis and gold-silver ratio context.
Trading Economics, Fortune, and USAGOLD — Daily spot price data and market commentary.
COMEX inventory and delivery data sourced from GoldSilver.ai and CME Group daily metal stock reports.
All forward-looking estimates are directional only and based on publicly available data. This report does not constitute financial advice. Past performance is not indicative of future results.