68% on ChatGPT. 24% on Gemini.
Same 25 questions. Wildly different AI answers.
25-query audit across ChatGPT, Gemini & Claude. Dash0 is cited on 37 of 75 responses (49.3%) with 6 first-place rankings. ChatGPT is Dash0’s strongest advocate. Gemini barely knows it exists.
This report was generated using Xtrusio, an AI visibility and demand intelligence platform that analyzes how companies appear across modern AI systems such as ChatGPT, Gemini, Claude, Perplexity, and other generative engines.
The insights in this page are generated using Xtrusio’s proprietary research and content intelligence framework.
Dash0 is cited more than Datadog on ChatGPT. An 18-month-old startup, founded by the Instana team, outperforms the $50B+ market leader on the world’s most-used AI platform — 17 citations vs ~6 for Datadog. But Gemini tells a completely different story: just 6 citations, never ranked #1. The Gemini Gap costs Dash0 44 percentage points vs its ChatGPT performance. Agent0, Dash0’s primary 2025–2026 product strategy, is invisible on both ChatGPT and Gemini — only Claude recognizes it.
Platform Scorecard
Dash0 citation rate across AI platforms
AI Visibility Leaderboard
Who owns the AI conversation — total citations across all platforms
AI Positioning Audit
25 buyer-intent queries — click any row to see the exact question
Each query was written from the perspective of a real decision-maker researching observability platforms during their discovery phase. These personas represent the SREs, platform engineers, VP Engineering, and CTOs whose AI search results determine whether Dash0 gets discovered.
| # | Query Topic | Cluster | Claude | ChatGPT | Gemini |
|---|---|---|---|---|---|
| 1 | Best observability for K8s | Kubernetes | ✓ | ✗ | ✓ |
|
Exact question asked across all AI platforms:
“What are the best observability platforms for monitoring Kubernetes-based microservices in production?” |
|||||
| 2 | Unify fragmented monitoring | Consolidation | ✓ | ✗ | ✗ |
|
Exact question asked across all AI platforms:
“We’re running 200+ microservices on Kubernetes and our current monitoring is fragmented across Prometheus, ELK, and Jaeger. What unified observability tools should we evaluate?” |
|||||
| 3 | Datadog $500K alternatives | Cost | ✗ | ✓ | ✗ |
|
Exact question asked across all AI platforms:
“I’m a VP of Engineering at a fintech company and our Datadog bill has grown to over $500K per year. What are the most cost-effective alternatives that still provide enterprise-grade observability?” |
|||||
| 4 | OTel-native platforms | OpenTelemetry | ✓ | ✓ | ✓ |
|
Exact question asked across all AI platforms:
“What observability platforms are built natively on OpenTelemetry rather than just supporting it as an integration?” |
|||||
| 5 | AI for SRE incident resolution | AI/Automation | ✓ | ✗ | ✗ |
|
Exact question asked across all AI platforms:
“How do modern observability tools use AI to help SRE teams reduce mean time to resolution during production incidents?” |
|||||
| 6 | Observability as code | DevOps/IaC | ✓ | ✓ | ✗ |
|
Exact question asked across all AI platforms:
“We need to implement observability as code so our monitoring configuration is version-controlled and deployed through our CI/CD pipeline. Which platforms support this natively?” |
|||||
| 7 | Datadog vs newer — pricing | Cost | ✗ | ✓ | ✗ |
|
Exact question asked across all AI platforms:
“What are the key differences between Datadog and newer observability platforms when it comes to pricing transparency and avoiding bill shock?” |
|||||
| 8 | Distributed tracing + OTel | Tracing | ✓ | ✓ | ✗ |
|
Exact question asked across all AI platforms:
“I’m evaluating distributed tracing solutions for our cloud-native application stack. Which tools provide the best trace-to-log correlation with full OpenTelemetry support?” |
|||||
| 9 | Self-service, no per-user fees | Cost | ✓ | ✓ | ✗ |
|
Exact question asked across all AI platforms:
“Our platform engineering team wants to provide self-service observability to all development teams without per-user licensing costs. What tools support this model?” |
|||||
| 10 | K8s operator auto-instrumentation | Kubernetes | ✓ | ✓ | ✗ |
|
Exact question asked across all AI platforms:
“What observability platforms offer the best Kubernetes operator for automated instrumentation without requiring developers to change their application code?” |
|||||
| 11 | Legacy APM → avoid lock-in | OpenTelemetry | ✓ | ✓ | ✓ |
|
Exact question asked across all AI platforms:
“We’re migrating from a legacy APM tool to something OpenTelemetry-native. What should we look for in a modern observability platform to avoid vendor lock-in?” |
|||||
| 12 | PromQL support | OpenTelemetry | ✓ | ✓ | ✗ |
|
Exact question asked across all AI platforms:
“What are the top observability tools that support PromQL for metrics querying so our existing Prometheus alerts and dashboards still work?” |
|||||
| 13 | AI SRE agents for triage | AI/Automation | ✓ | ✗ | ✗ |
|
Exact question asked across all AI platforms:
“I’m a Director of SRE at an enterprise software company. How are AI-powered SRE agents being used in observability platforms to automate incident triage and root cause analysis?” |
|||||
| 14 | Per-telemetry transparent pricing | Cost | ✓ | ✓ | ✓ |
|
Exact question asked across all AI platforms:
“Which observability platforms provide transparent, per-telemetry pricing rather than charging per host, per user, or per GB of data ingested?” |
|||||
| 15 | API-first for internal platform | DevOps/IaC | ✓ | ✓ | ✗ |
|
Exact question asked across all AI platforms:
“We’re building an internal developer platform and need to embed observability into it. Which tools have the strongest API-first and configuration-as-code capabilities?” |
|||||
| 16 | Open-source observability state | Open Source | ✗ | ✗ | ✗ |
|
Exact question asked across all AI platforms:
“What’s the current state of open-source observability platforms that can compete with commercial tools like Datadog and New Relic for enterprise use cases?” |
|||||
| 17 | Grafana Cloud vs commercial | Open Source | ✗ | ✗ | ✗ |
|
Exact question asked across all AI platforms:
“How do I choose between Grafana Cloud and a commercial observability platform for a team of 50 engineers running workloads across AWS and GCP?” |
|||||
| 18 | Service map visualization | Tracing | ✗ | ✗ | ✗ |
|
Exact question asked across all AI platforms:
“Which observability tools provide the best service map visualization for understanding dependencies across distributed microservices?” |
|||||
| 19 | Infra + serverless unified | Multi-Signal | ✗ | ✗ | ✗ |
|
Exact question asked across all AI platforms:
“I’m looking for an observability platform that can monitor both traditional infrastructure and serverless workloads like AWS Lambda in a single pane of glass. What are my options?” |
|||||
| 20 | OTel standardization selection | OpenTelemetry | ✗ | ✓ | ✗ |
|
Exact question asked across all AI platforms:
“What are the most important factors to consider when selecting an observability tool for a company that’s standardizing on OpenTelemetry for all telemetry data collection?” |
|||||
| 21 | RUM + synthetic + backend | Multi-Signal | ✗ | ✓ | ✗ |
|
Exact question asked across all AI platforms:
“We need real user monitoring and synthetic monitoring alongside our backend observability. Which platforms provide a truly unified experience across all these signals?” |
|||||
| 22 | High-cardinality data | Performance | ✗ | ✓ | ✓ |
|
Exact question asked across all AI platforms:
“How do modern observability platforms handle high-cardinality data without the query performance degrading or costs exploding?” |
|||||
| 23 | Platform eng shared service | Platform Eng | ✗ | ✓ | ✗ |
|
Exact question asked across all AI platforms:
“What observability solutions are best suited for platform engineering teams that want to manage monitoring as a shared service across 20+ product teams?” |
|||||
| 24 | Series B startup setup | Getting Started | ✗ | ✓ | ✗ |
|
Exact question asked across all AI platforms:
“I’m a CTO at a Series B SaaS startup and need to set up observability from scratch. We use Kubernetes on AWS with about 50 services. What should I consider when choosing a platform?” |
|||||
| 25 | Newest funded challengers | Market Map | ✓ | ✓ | ✓ |
|
Exact question asked across all AI platforms:
“Which observability platforms are the newest entrants backed by serious funding that are challenging the established players like Datadog and Dynatrace?” |
|||||
| TOTAL | 14/25 (56%) | 17/25 (68%) | 6/25 (24%) | ||
Semrush AI Visibility
Automated scores vs buyer-intent reality
Semrush AI Visibility gives dash0.com a score of 20/100 — categorized as “Low” and “rarely mentioned in LLM outputs compared to competitors.” But our 25-query buyer-intent audit tells a completely different story: Dash0 is cited on 49.3% of all responses and leads the entire competitive field with 37 total citations. The disconnect is explained by brand name dilution and Semrush’s inability to distinguish buyer-intent queries from generic mentions.
| Company | Semrush Score | Mentions | Citations | Buyer-Intent (Xtrusio) |
|---|---|---|---|---|
| dash0.com | 20/100 | 323 | 2.6K | 49.3% |
| datadoghq.com | 55/100 | 22.1K | 8.8K | 41% |
| grafana.com | 56/100 | 18.1K | 3.8K | 47% |
| dynatrace.com | 41/100 | 7.1K | 4.8K | 24% |
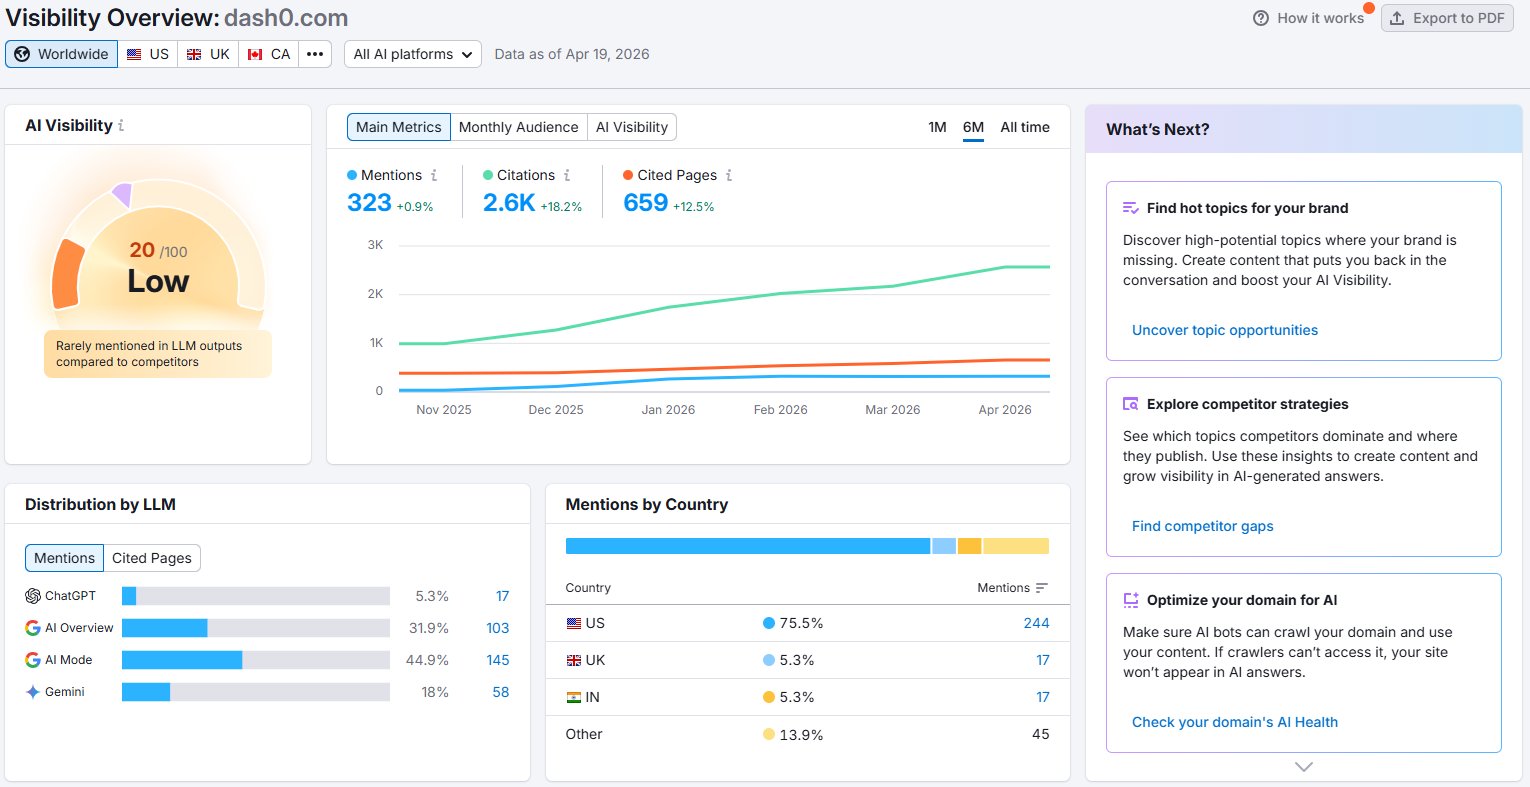
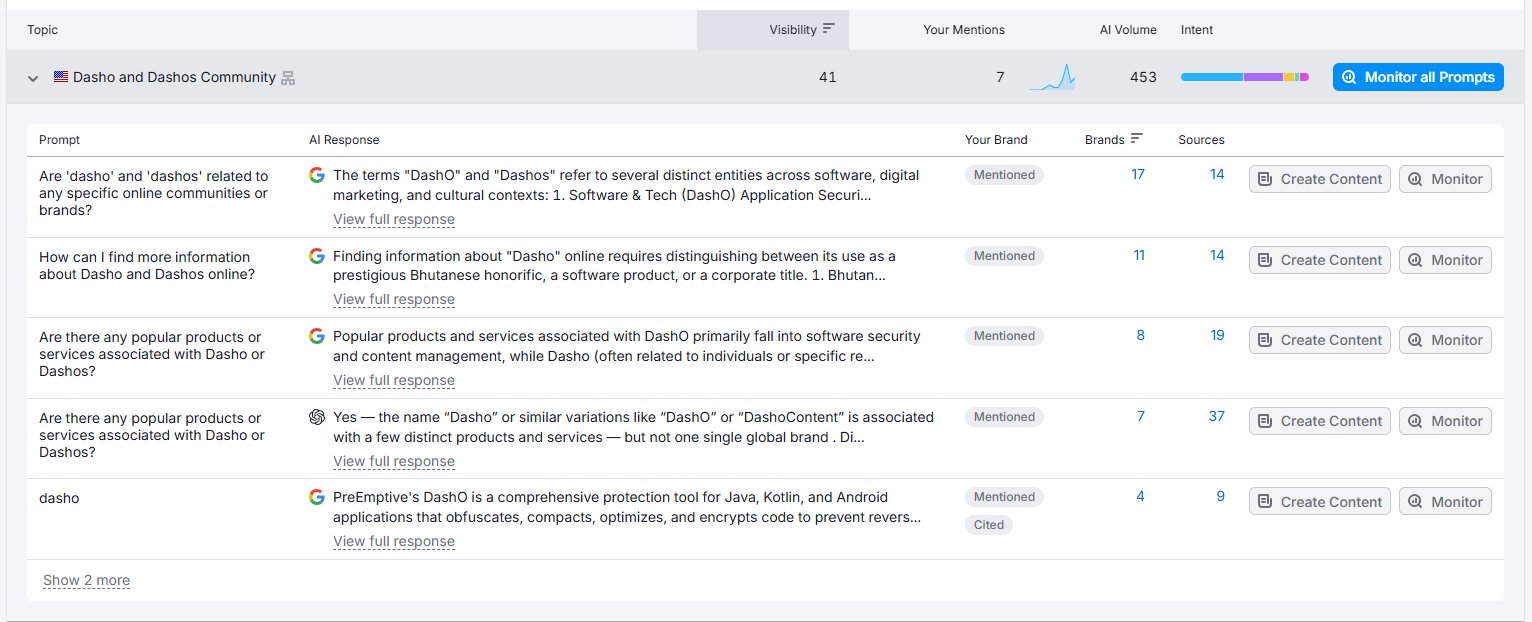
Semrush scores Dash0 at 20/100 with only 323 mentions — but its Topics tab reveals the root cause: brand name dilution. Semrush tracks “DashO” (PreEmptive’s Java obfuscation tool) and “Dasho” (a Bhutanese honorific title) under the same topic cluster. The actual observability platform Dash0 is buried beneath irrelevant brand-name collisions, making Semrush’s 20/100 score functionally meaningless for assessing real buyer-intent visibility.
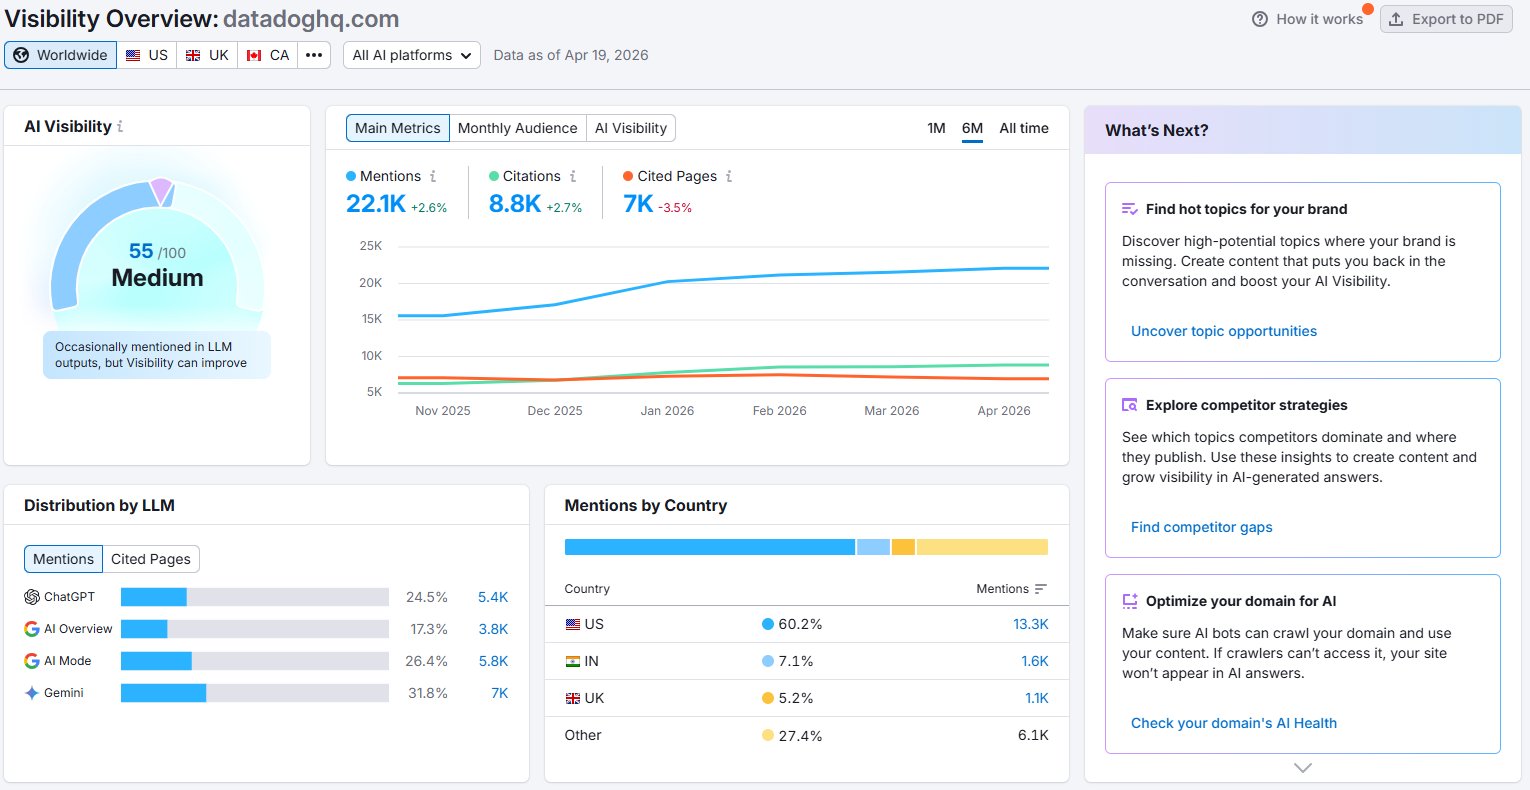
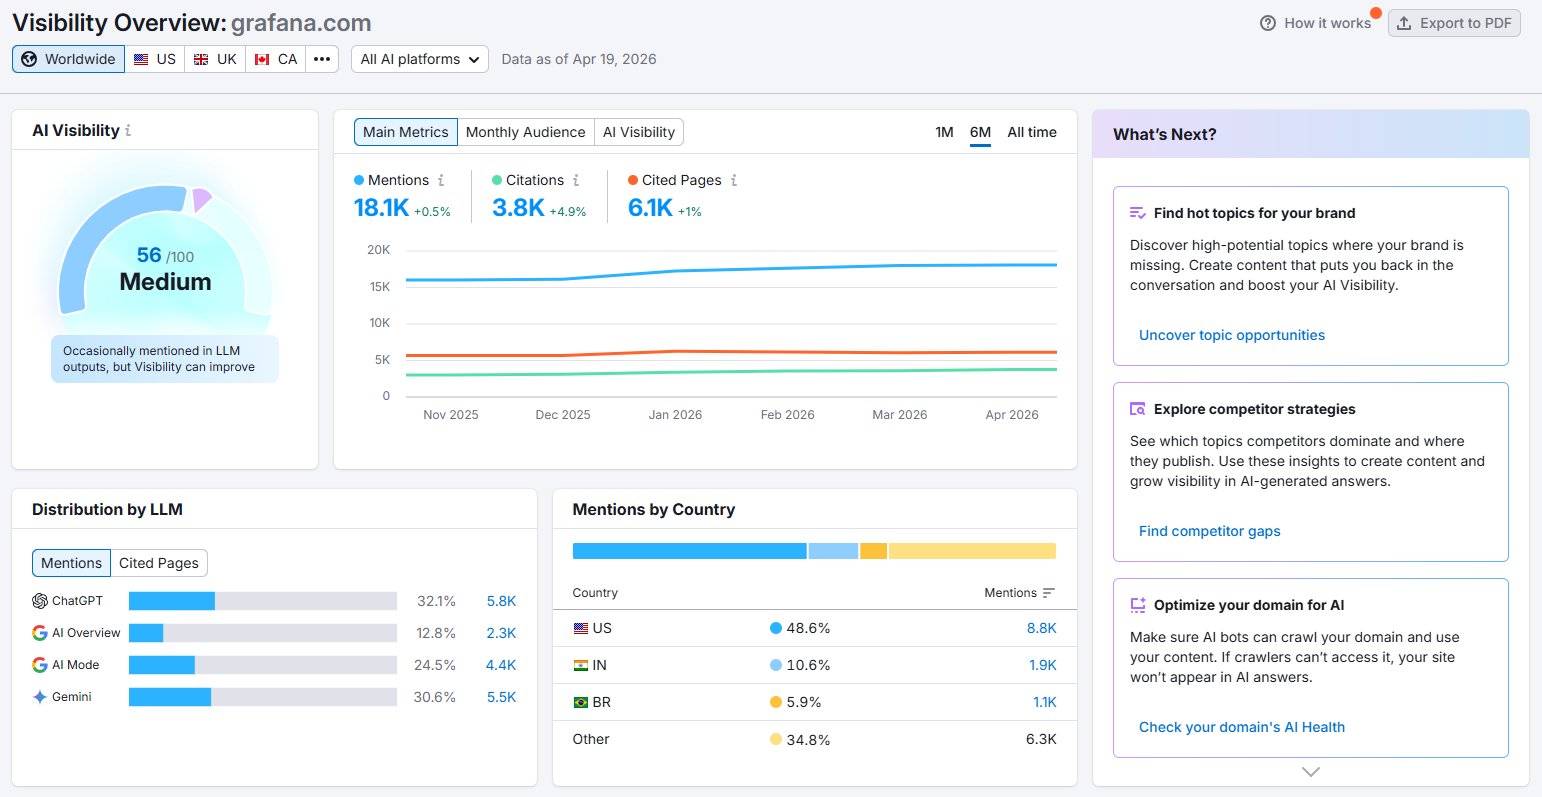
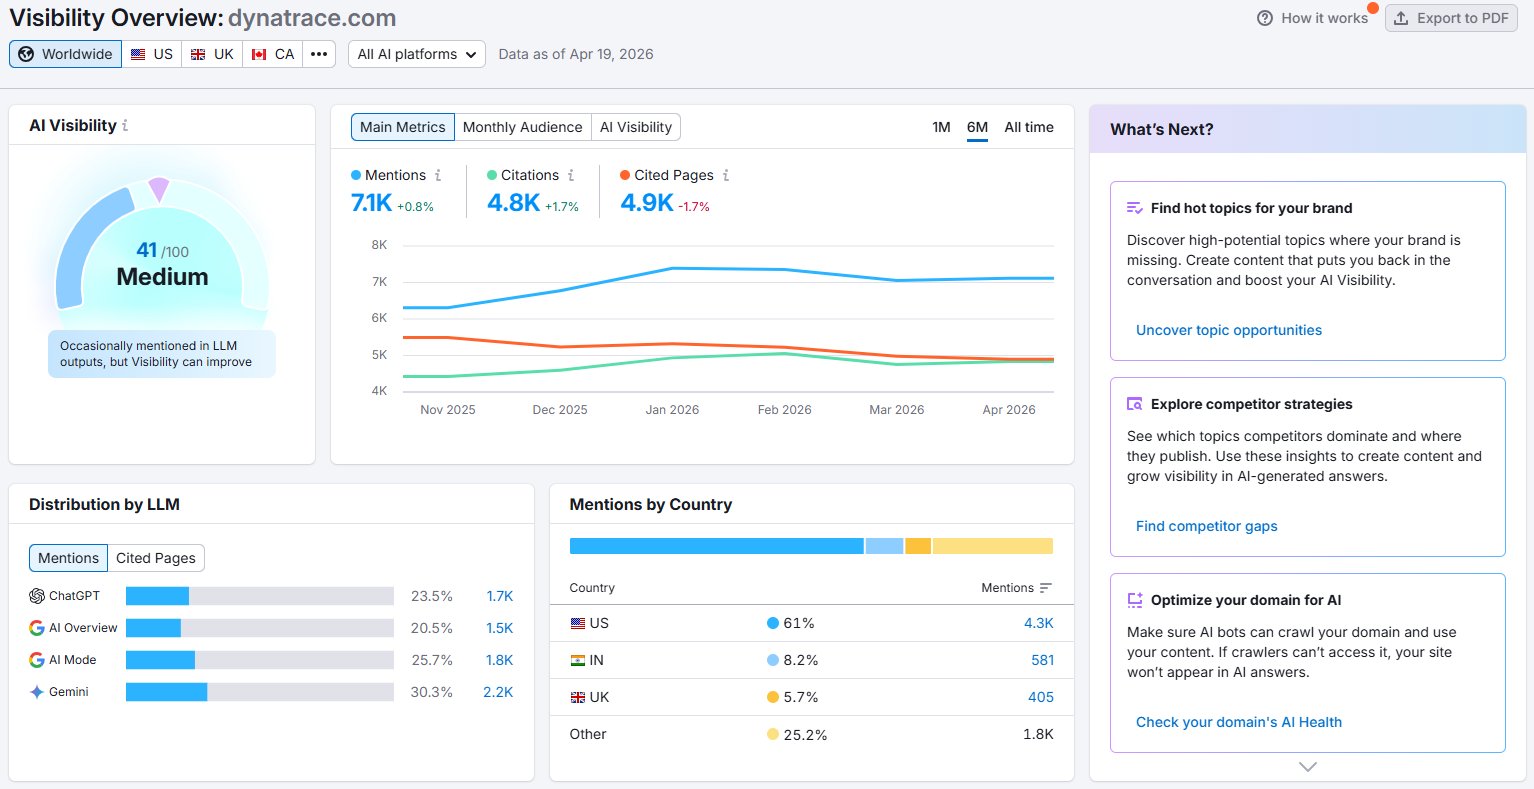
Datadog (55/100) and Grafana (56/100) lead on Semrush scores thanks to massive mention volumes (22K and 18K respectively). But on buyer-intent queries, Dash0 outperforms both. Dynatrace at 41/100 and 7.1K mentions correlates more closely with its actual 24% buyer-intent rate — suggesting Semrush scores are more accurate for established vendors than for newer challengers with brand-name ambiguity.
The Gemini Gap
Where Dash0 loses 44 percentage points vs ChatGPT
When an SRE Director asks ChatGPT about observability, Dash0 appears 68% of the time. When that same person asks Gemini the exact same questions, Dash0 appears only 24% of the time. The gap is not random — it follows a pattern: Gemini defaults to established vendors (Datadog, Grafana, Honeycomb, Chronosphere) while ignoring newer OTel-native challengers.
“Our platform engineering team wants to provide self-service observability to all development teams without per-user licensing costs. What tools support this model?”
“We need to implement observability as code so our monitoring configuration is version-controlled and deployed through our CI/CD pipeline. Which platforms support this natively?”
“How are AI-powered SRE agents being used in observability platforms to automate incident triage and root cause analysis?”
Dash0’s content clearly works — ChatGPT proves it with 68% citation rates. But Gemini doesn’t see it. The likely cause: Gemini relies more heavily on third-party editorial coverage, G2/Capterra category pages, and established comparison content — areas where an 18-month-old company naturally has less presence than Datadog or Grafana. Closing this gap requires targeted content that surfaces in Gemini’s training pipeline: comparison pages, technical blog posts indexed by Google, and third-party mentions on high-authority domains.
AI Topic Authority Map
Which categories Dash0 owns in AI answers
| Topic | AI Leader | Dash0 Status |
|---|---|---|
| Transparent Pricing | Dash0 | UNANIMOUS #1 (3/3) |
| OpenTelemetry-Native Architecture | Dash0 / Honeycomb | 3 of 3 platforms |
| Vendor Lock-in Avoidance | Dash0 | 3 of 3 platforms |
| Market Challengers / Funding | Dash0 | 3 of 3 platforms |
| Kubernetes Operator | Dash0 | 2 of 3 (Claude #1) |
| Observability as Code | Grafana Cloud | 2 of 3 platforms |
| PromQL Compatibility | Grafana Cloud | 2 of 3 platforms |
| Self-Service / No Per-User | Dash0 | 2 of 3 (ChatGPT #1) |
| AI / Agentic Observability | Dynatrace / Datadog | Claude only (1/3) |
| Serverless / Lambda Monitoring | Datadog / New Relic | INVISIBLE (0/3) |
| RUM + Synthetic + Frontend | Datadog / Dynatrace | INVISIBLE (0/3) |
| Service Map Visualization | Dynatrace | INVISIBLE (0/3) |
| Open Source Observability | Grafana / SigNoz | INVISIBLE (0/3) |
Methodology
How we conducted this Xtrusio AEO/GEO Audit
This research is based on Xtrusio’s proprietary AI visibility analysis framework.
Recommendations
Prioritized actions to close the Gemini gap and amplify Agent0 visibility
- Publish “Dash0 vs Datadog” and “Dash0 vs Grafana Cloud” comparison pages on dash0.com (Gemini heavily weights comparison content indexed by Google)
- Target G2, Capterra, and PeerSpot profiles with fresh customer reviews — Gemini pulls from these category pages when recommending observability tools
- Secure guest posts on DevOps/SRE publications (The New Stack, InfoQ, DevOps.com) mentioning Dash0 in “observability tools” and “Datadog alternatives” contexts
- Create dedicated “Agent0 vs Dynatrace Davis AI vs Datadog Bits AI” comparison content — currently Agent0 is invisible on ChatGPT and Gemini
- Publish serverless/Lambda observability content highlighting Lumigo acquisition — Q19 (serverless) shows 0/3 citations; Gemini still tracks Lumigo as standalone
- Target “AI SRE agents” and “agentic observability” keyword clusters with technical blog content showing Agent0 in real-world incident resolution workflows
- Expand into RUM/synthetic/frontend content — currently 0/3 on Q21. Build “Dash0 for frontend observability” positioning to compete with Datadog RUM
- Quarterly Xtrusio re‑audits to track Gemini gap closure and Agent0 visibility progress
Close the Gemini Gap. Amplify Agent0.
Dash0 is winning on ChatGPT and Claude. Let’s make Gemini catch up.
This research report was generated using the Xtrusio Company Intelligence Module.